

Python – Chart Properties
Python has excellent libraries for data visualization. A combination of Pandas, numpy and matplotlib can help in creating in nearly all types of visualizations charts. In this chapter we will get started with looking at some simple chart and the various properties of the chart.
Creating a Chart
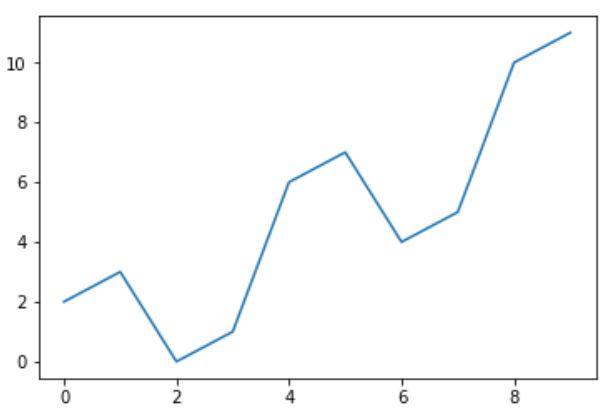
We use numpy library to create the required numbers to be mapped for creating the chart and the pyplot method in matplotlib to draws the actual chart.
import numpy as np
import matplotlib.pyplot as plt

x = np.arange(0,10)
y = x ^ 2
#Simple Plot
plt.plot(x,y)
Its output is as follows −
Labling the Axes
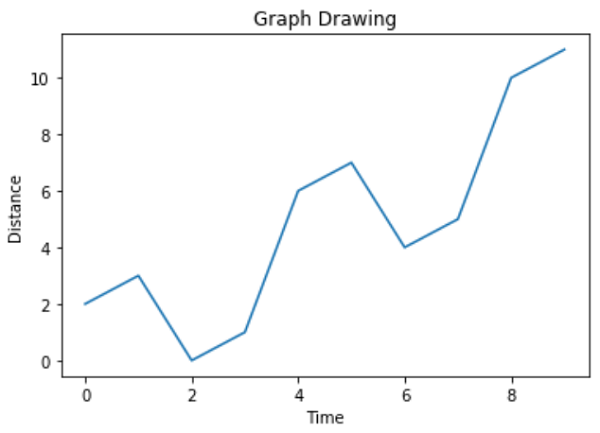
We can apply labels to the axes as well as a title for the chart using appropriate methods from the library as shown below.
import numpy as np
import matplotlib.pyplot as plt

x = np.arange(0,10)
y = x ^ 2
#Labeling the Axes and Title
plt.title("Graph Drawing")
plt.xlabel("Time")
plt.ylabel("Distance")
#Simple Plot
plt.plot(x,y)
Its output is as follows −
Formatting Line type and Colour
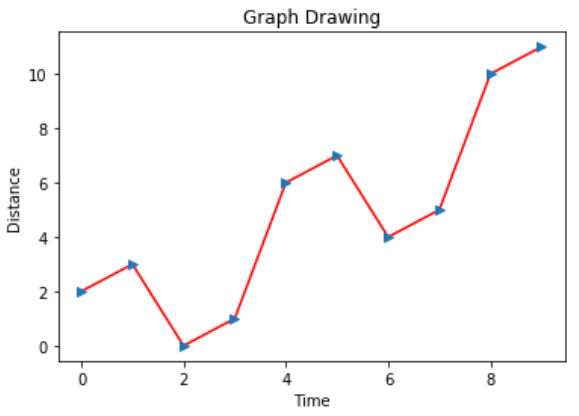
The style as well as colour for the line in the chart can be specified using appropriate methods from the library as shown below.
import numpy as np
import matplotlib.pyplot as plt

x = np.arange(0,10)
y = x ^ 2
#Labeling the Axes and Title
plt.title("Graph Drawing")
plt.xlabel("Time")
plt.ylabel("Distance")

# Formatting the line colors
plt.plot(x,y,'r')

# Formatting the line type
plt.plot(x,y,'>')
Its output is as follows −
Saving the Chart File
The chart can be saved in different image file formats using appropriate methods from the library as shown below.
import numpy as np
import matplotlib.pyplot as plt

x = np.arange(0,10)
y = x ^ 2
#Labeling the Axes and Title
plt.title("Graph Drawing")
plt.xlabel("Time")
plt.ylabel("Distance")

# Formatting the line colors
plt.plot(x,y,'r')

# Formatting the line type
plt.plot(x,y,'>')

# save in pdf formats
plt.savefig('timevsdist.pdf', format='pdf')
The above code creates the pdf file in the default path of the python environment.