Python – Binomial Distribution
The binomial distribution model deals with finding the probability of success of an event which has only two possible outcomes in a series of experiments. For example, tossing of a coin always gives a head or a tail. The probability of finding exactly 3 heads in tossing a coin repeatedly for 10 times is estimated during the binomial distribution.
We use the seaborn python library which has in-built functions to create such probability distribution graphs. Also, the scipy package helps is creating the binomial distribution.
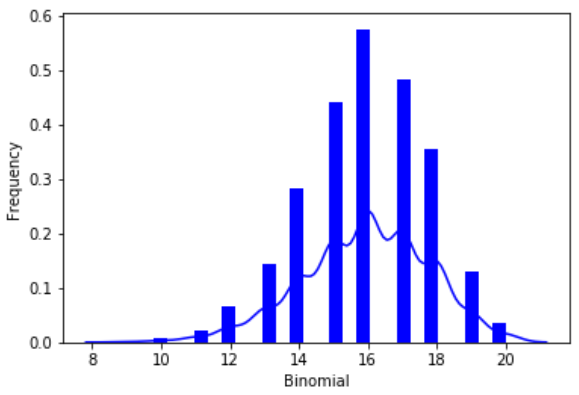
from scipy.stats import binom
import seaborn as sb

binom.rvs(size=10,n=20,p=0.8)

data_binom = binom.rvs(n=20,p=0.8,loc=0,size=1000)
ax = sb.distplot(data_binom,
                  kde=True,
                  color='blue',
                  hist_kws={"linewidth": 25,'alpha':1})
ax.set(xlabel='Binomial', ylabel='Frequency')
Its output is as follows −