Python – Chi-Square Test
Chi-Square test is a statistical method to determine if two categorical variables have a significant correlation between them. Both those variables should be from same population and they should be categorical like − Yes/No, Male/Female, Red/Green etc. For example, we can build a data set with observations on people’s ice-cream buying pattern and try to correlate the gender of a person with the flavour of the ice-cream they prefer. If a correlation is found we can plan for appropriate stock of flavours by knowing the number of gender of people visiting.
We use various functions in numpy library to carry out the chi-square test.
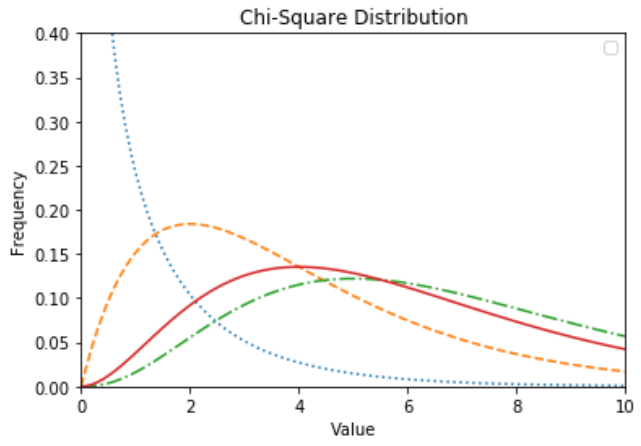
from scipy import stats
import numpy as np
import matplotlib.pyplot as plt

x = np.linspace(0, 10, 100)
fig,ax = plt.subplots(1,1)

linestyles = [':', '--', '-.', '-']
deg_of_freedom = [1, 4, 7, 6]
for df, ls in zip(deg_of_freedom, linestyles):
  ax.plot(x, stats.chi2.pdf(x, df), linestyle=ls)

plt.xlim(0, 10)
plt.ylim(0, 0.4)

plt.xlabel('Value')
plt.ylabel('Frequency')
plt.title('Chi-Square Distribution')

plt.legend()
plt.show()
Its output is as follows −